Skip to content

The Frontend

The user-facing frontend gives teams a read-only view of license health, usage, demand, applications, users, denials, inventory, and reports. It is intended for operators, engineering managers, procurement teams, and anyone who needs to understand license consumption without entering the Admin UI.

For operator-only monitor status, recent logs, parser warnings, and polling-cycle metrics, use Live View. Live View is generated by limon-monitor after each run and is linked from both the Admin UI and the Frontend jump menu.

Header Tour

The header is shared across frontend pages, so the same controls stay available while users move from the dashboard into a detail or report view.

Annotated LiMon frontend header with numbered markers for navigation and status controls
The numbered markers identify the persistent navigation and context controls in the frontend header.
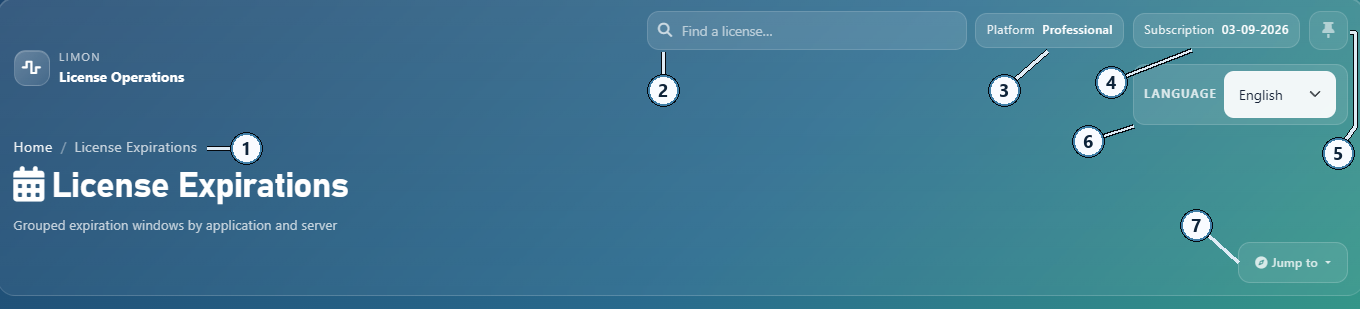
  • 1Breadcrumb. Shows the current page path, starting from Home, so users can tell where they are in the frontend.
  • 2Search. Opens quick license lookup from anywhere in the frontend.
  • 3Platform. Shows the active platform tier, such as Standard or Professional.
  • 4Subscription. Shows the current subscription/update entitlement expiration date.
  • 5Pin/unpin. Pins the current page to dashboard shortcuts, or removes it when already pinned.
  • 6Language selector. Switches the frontend language for the current user.
  • 7Page selector. Opens the Jump to menu for main frontend pages, including Live View.
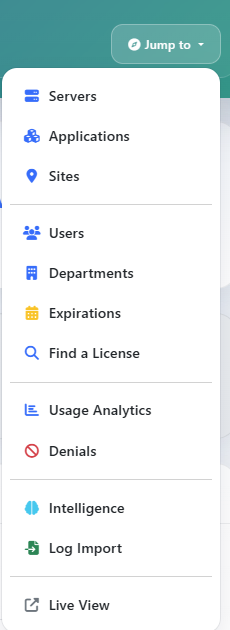
Jump Menu

The Jump Menu is also shared across frontend pages. It gives users a quick way to move between the main analysis views, saved/pinned destinations, and the monitor-generated Live View without returning to the dashboard first.

LiMon frontend Jump Menu with common page shortcuts
The Jump Menu keeps the primary frontend destinations available from every page.

Main Page Examples

The captures below show representative frontend pages. They are examples of the main license-analysis, inventory, usage, denial, import, and intelligence views rather than an exhaustive page-by-page tour.

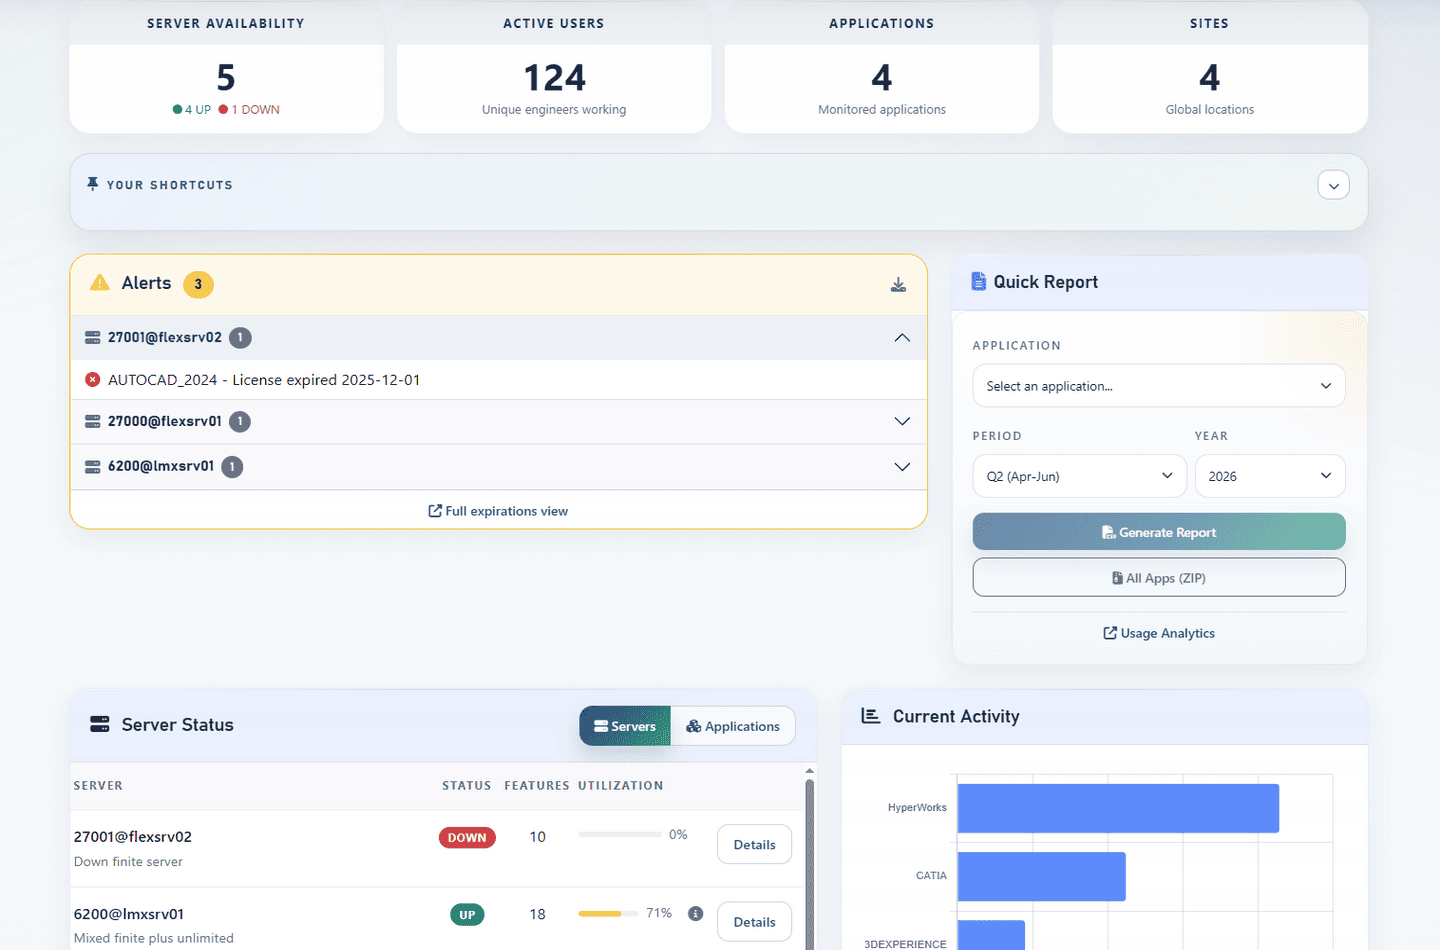
Example of the dashboard:

LiMon frontend dashboard with KPI cards, alerts, shortcuts, and quick report controls
The dashboard summarizes server availability, active users, monitored applications, sites, alerts, and quick usage reports.

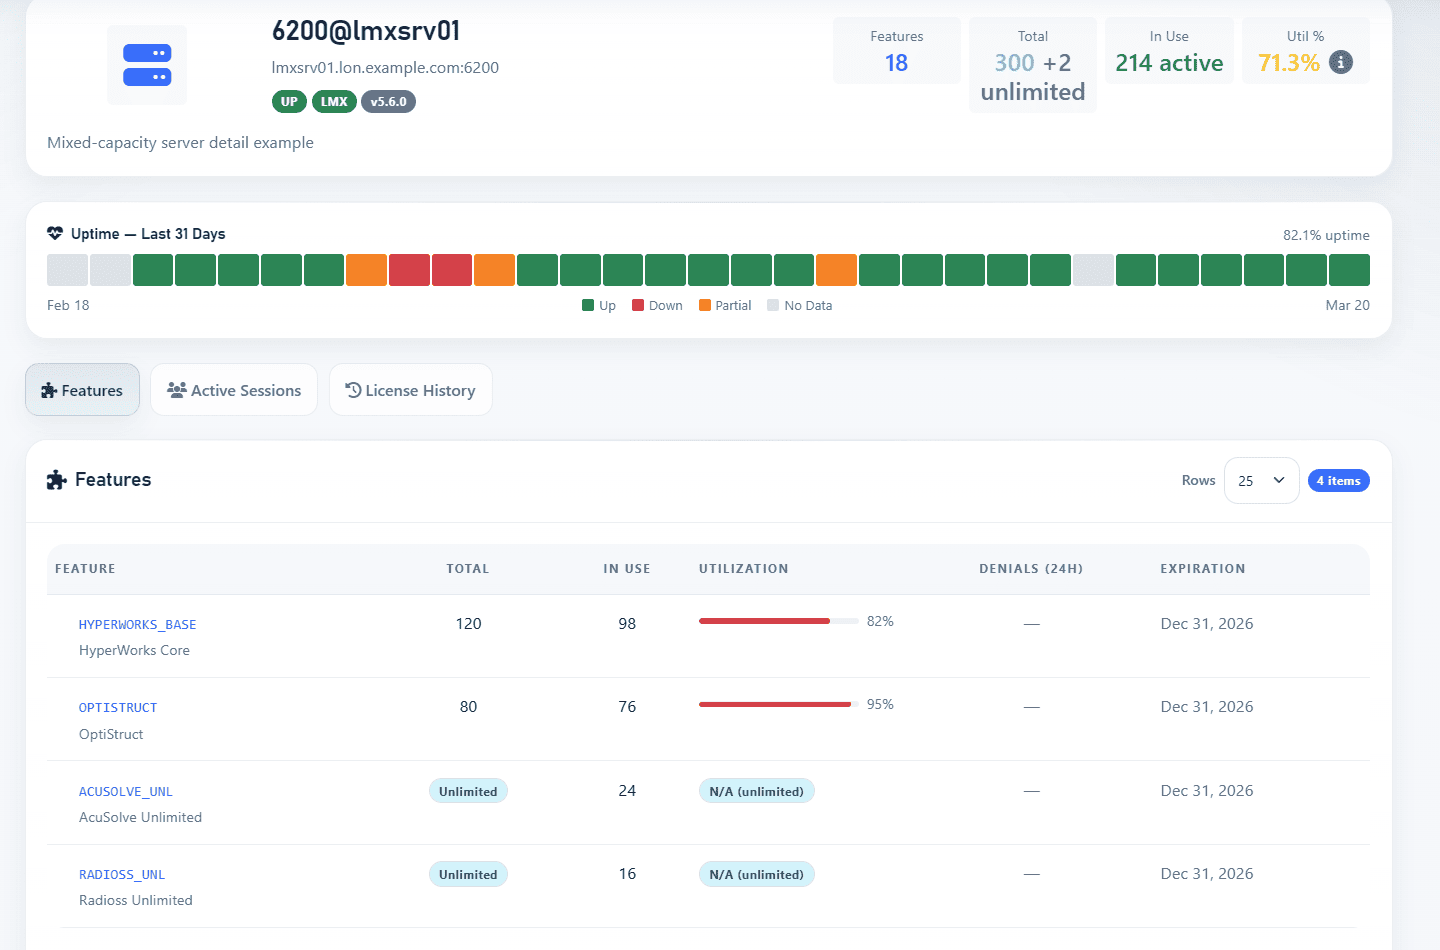
Example of a server detail page:

Server detail page showing a license server, utilization, availability, and feature usage
Server detail pages show endpoint health, inventory, feature utilization, active sessions, and recent history.

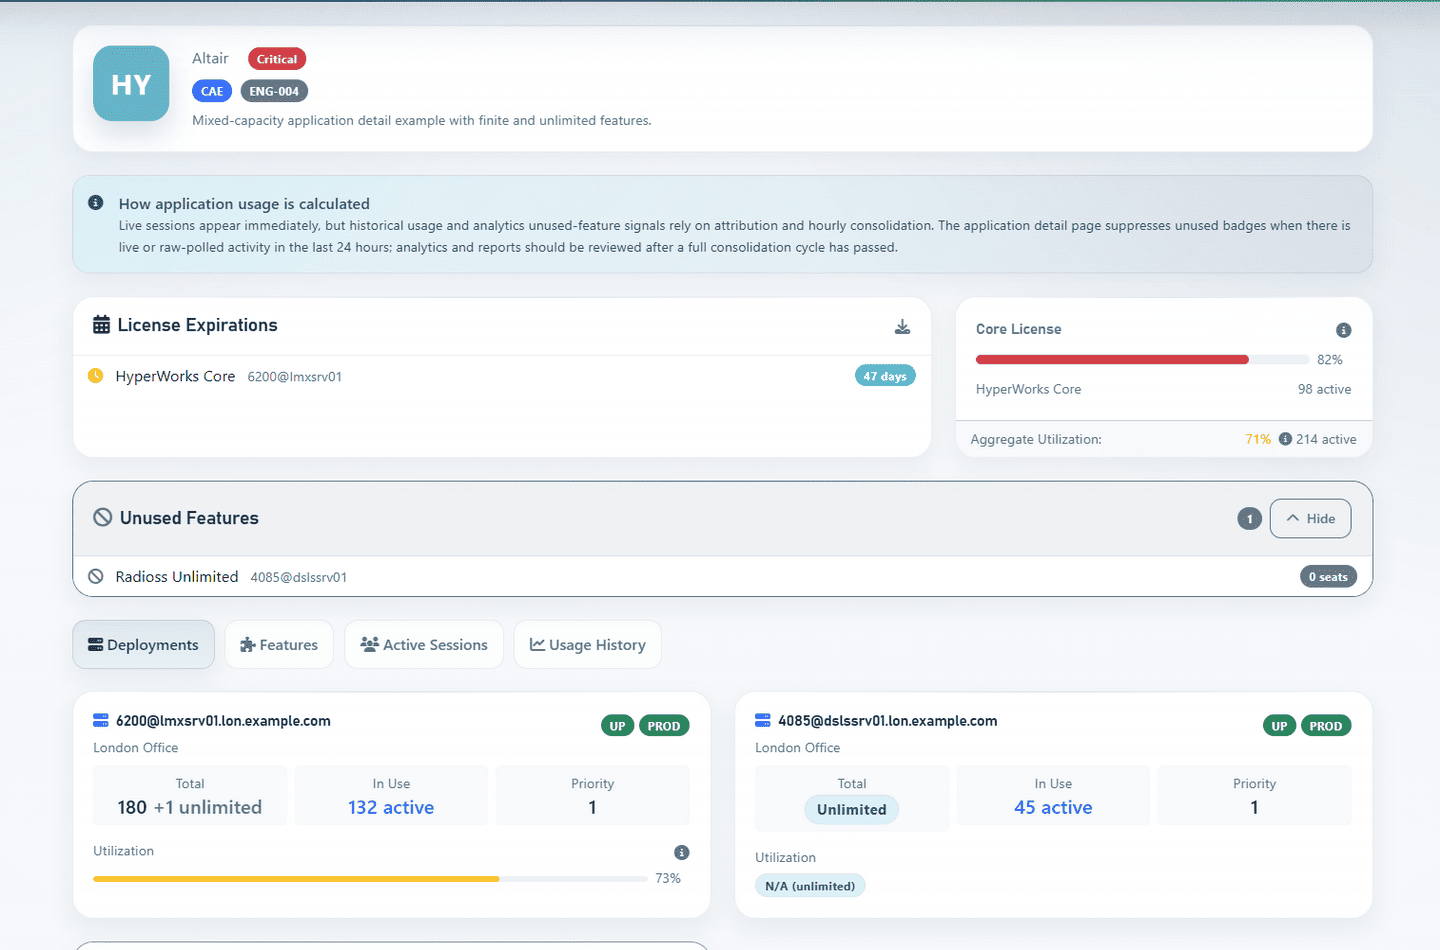
Example of an application detail page:

Application detail page showing product-level license usage and deployment information
Application views group vendor feature codes into product-level usage, deployments, trends, and users.

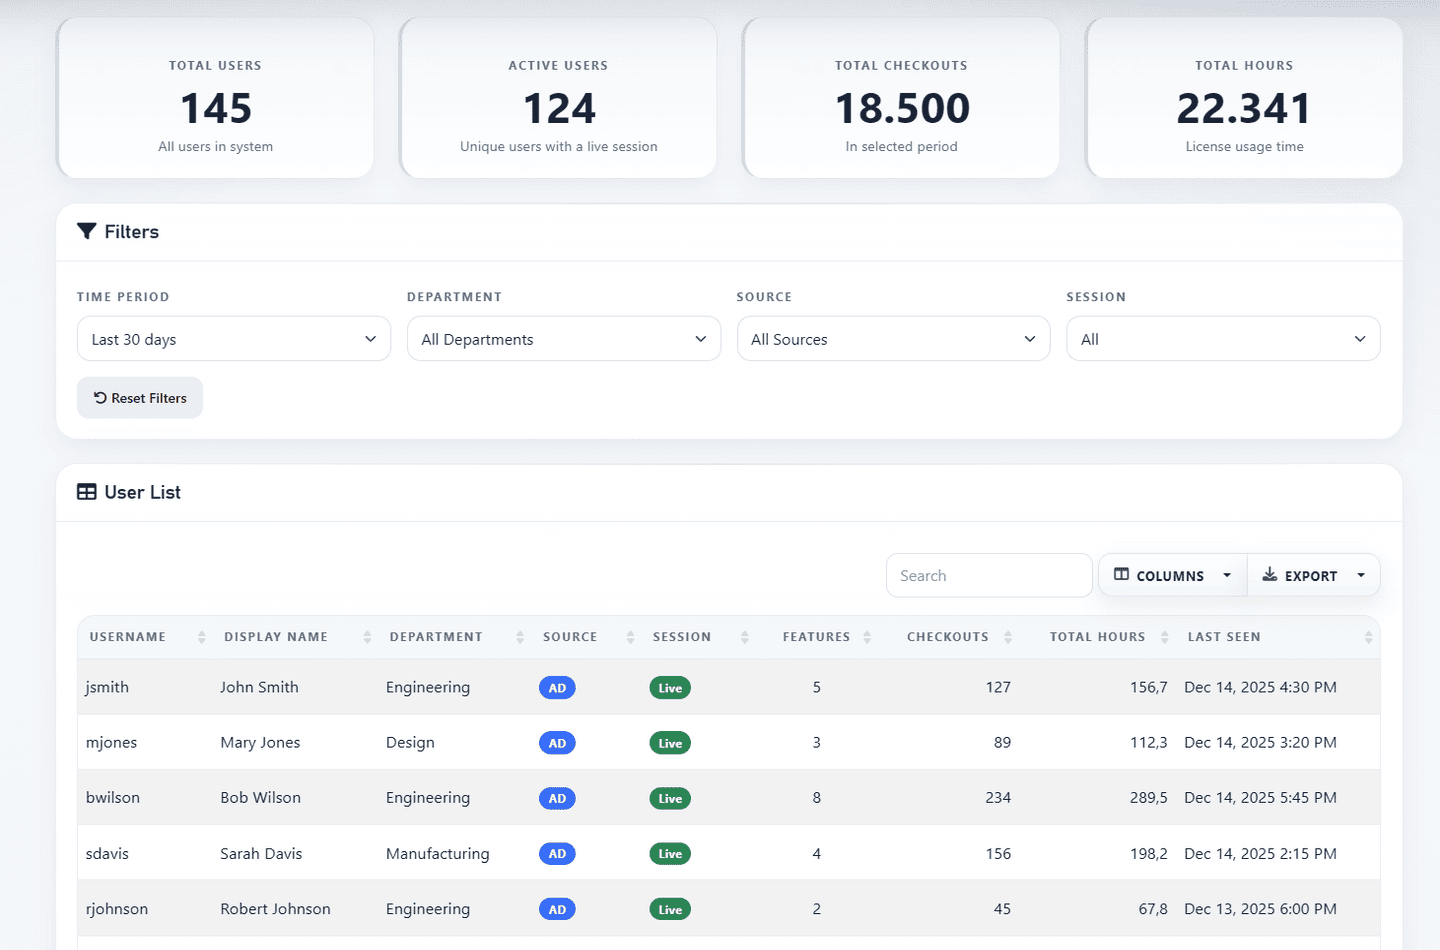
Example of the users view:

Users page showing active license users and their activity
User views help identify who is consuming licenses. Directory enrichment adds AD/LDAP context when enabled. Pro Sub

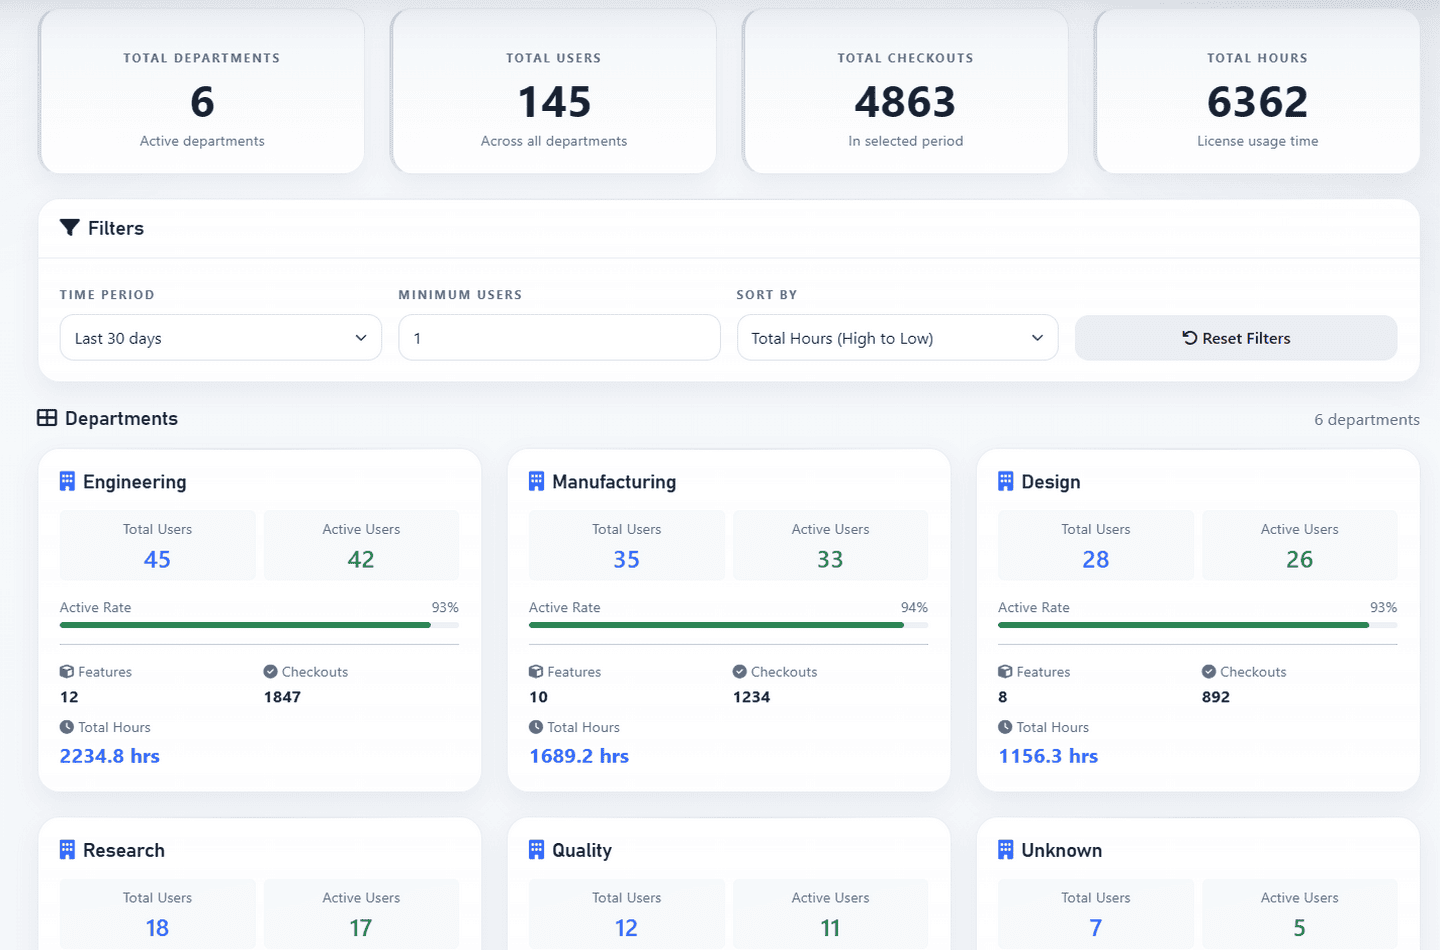
Example of departments overview:

Department analytics page showing license usage by department
Open a department to see analytics roll license activity up to business groups when AD/LDAP enrichment is available. Pro Sub

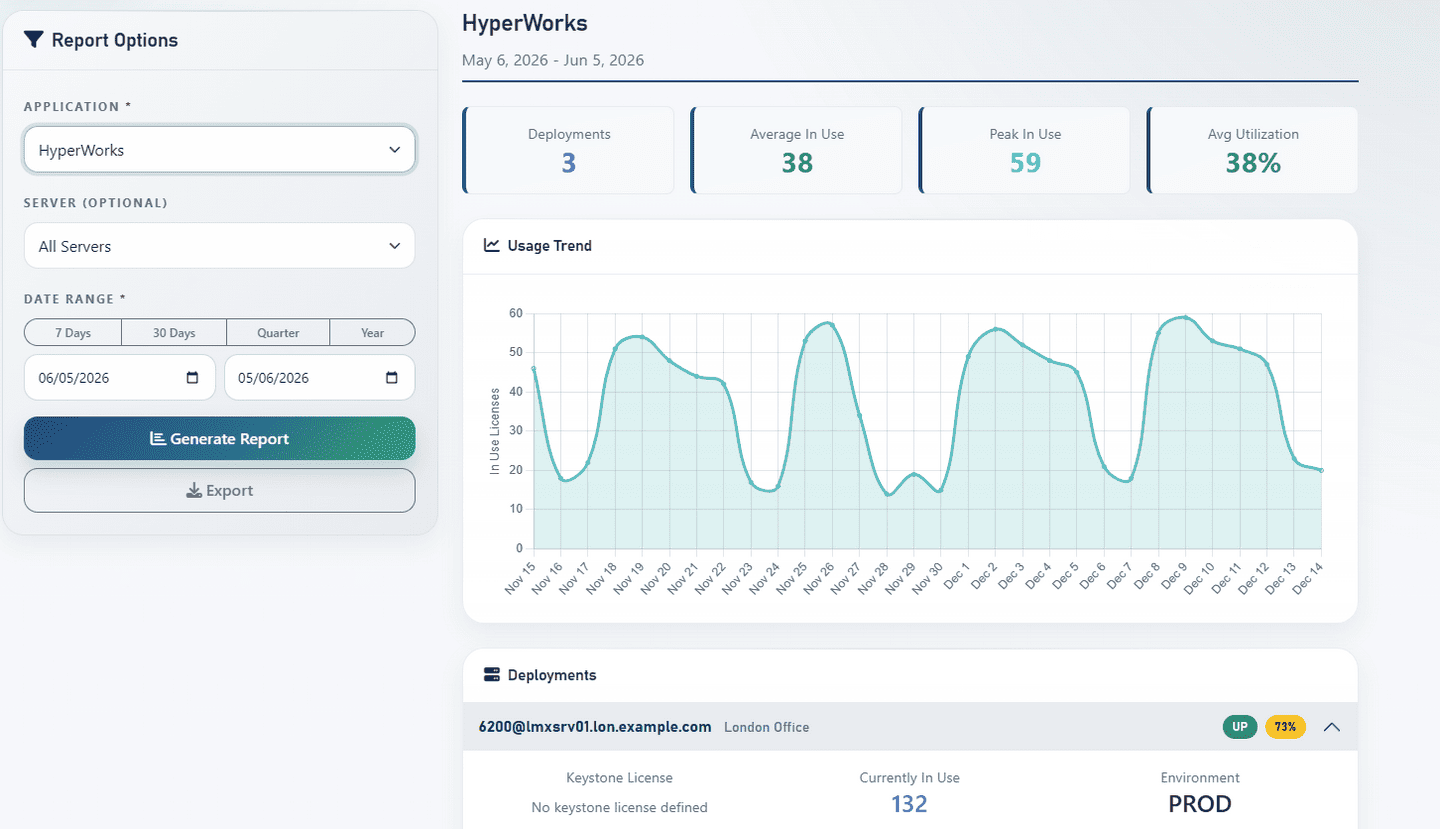
Usage and denial views help answer practical questions: which features are busy, who is using them, when peaks happen, and where users are blocked by denials. Expiration and license search views make it easier to inspect inventory and upcoming renewal risk.

Example of usage analytics:

Usage analytics page with report filters and usage report tabs
Usage analytics provides report builders for application, user, department, denial, and custom views.

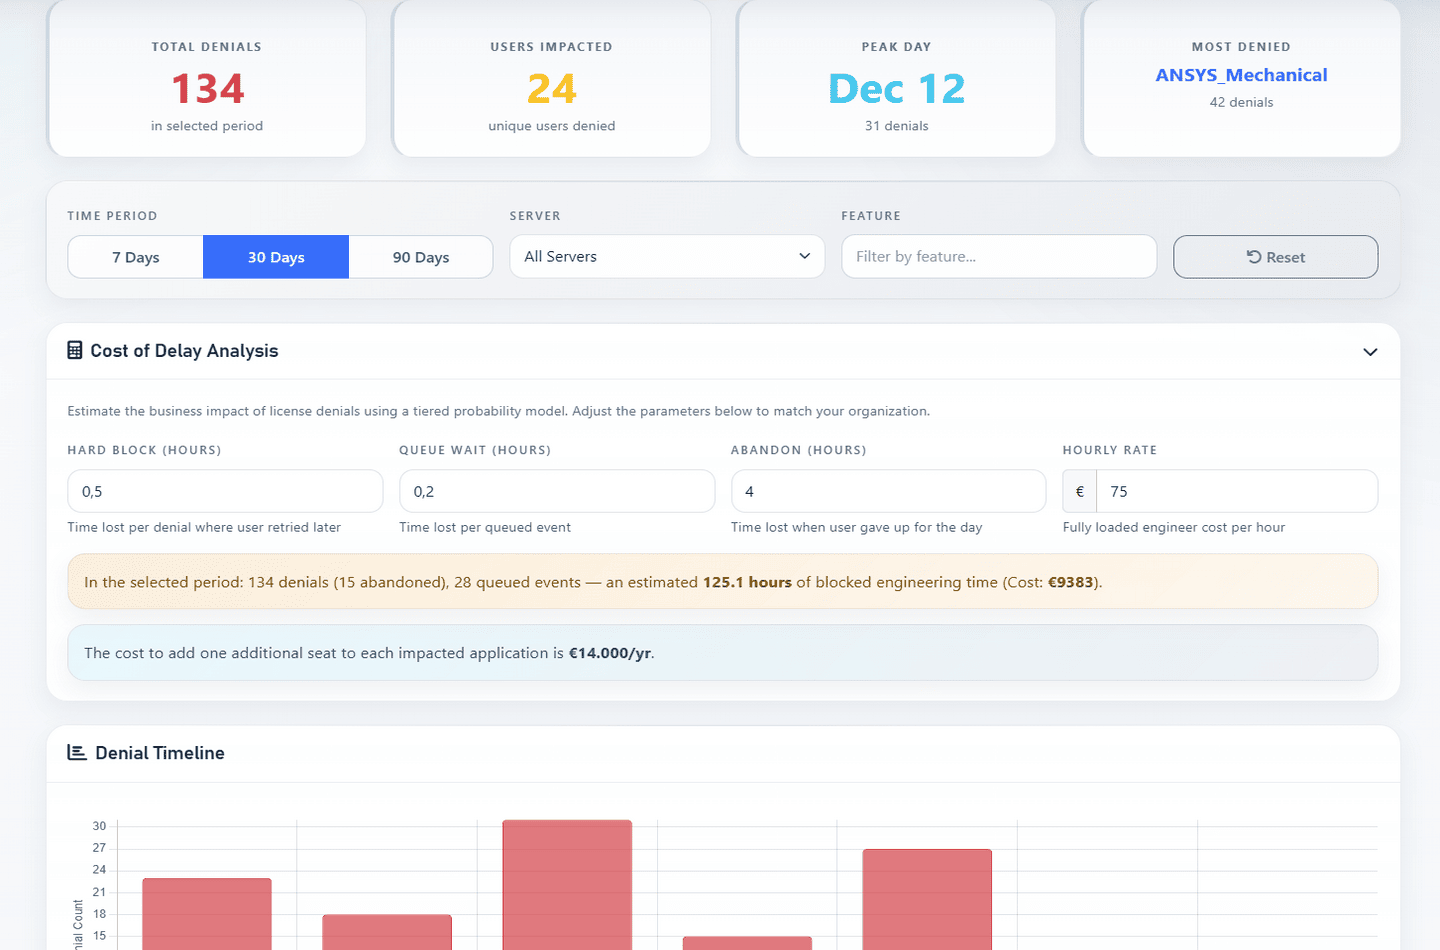
Example of denials tracking:

License denials page showing denial event tracking and filters
Denials tracking highlights blocked checkout attempts from imported license server logs.

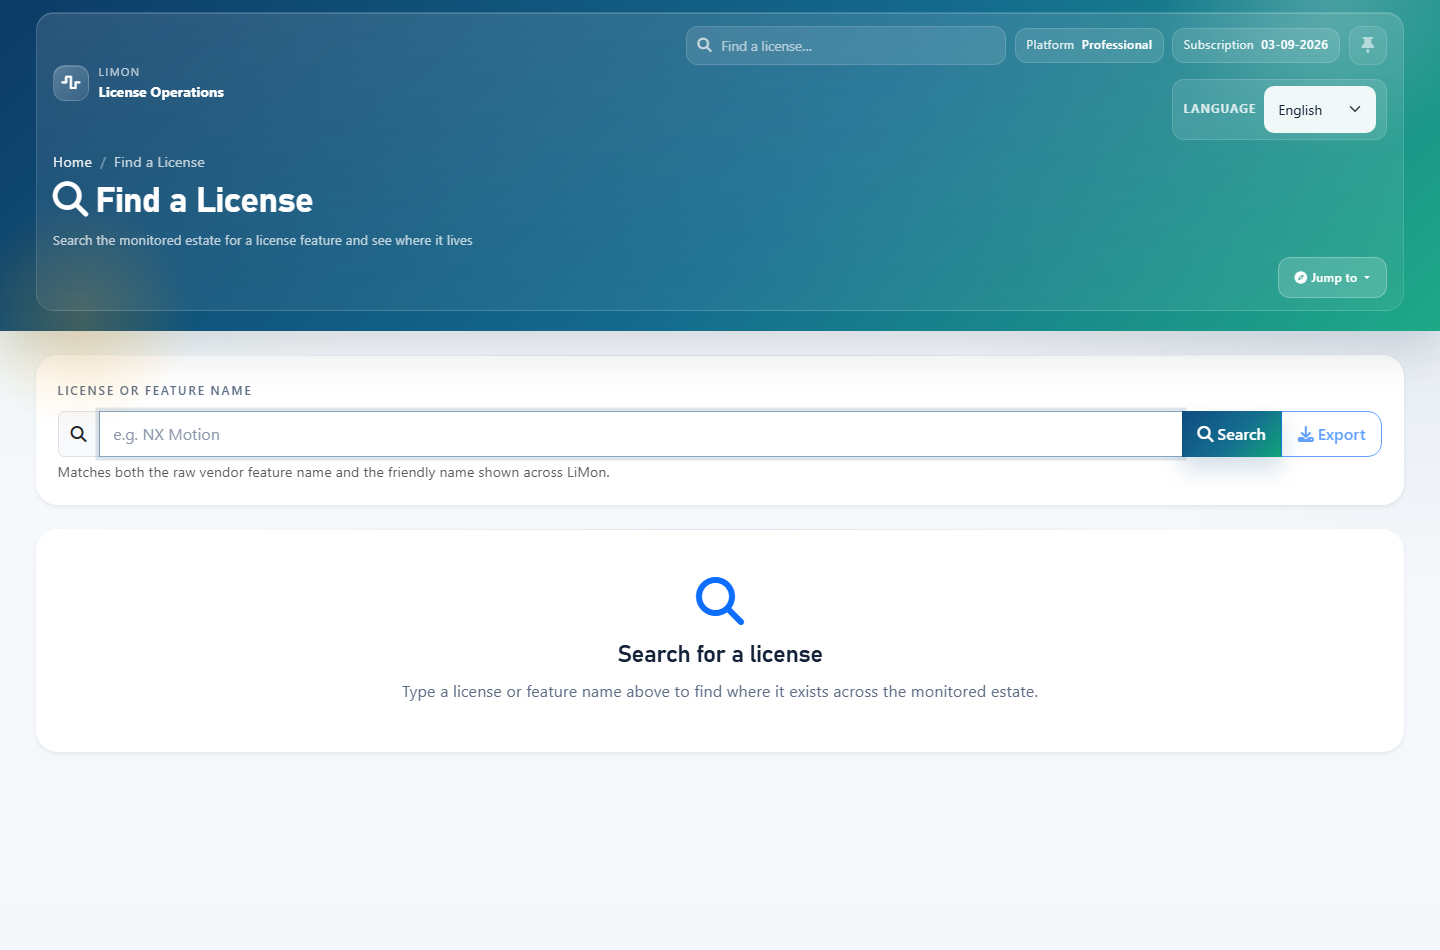
Example of license search:

Find a License page for searching monitored license inventory
License search helps locate monitored inventory across servers, vendors, features, and applications.

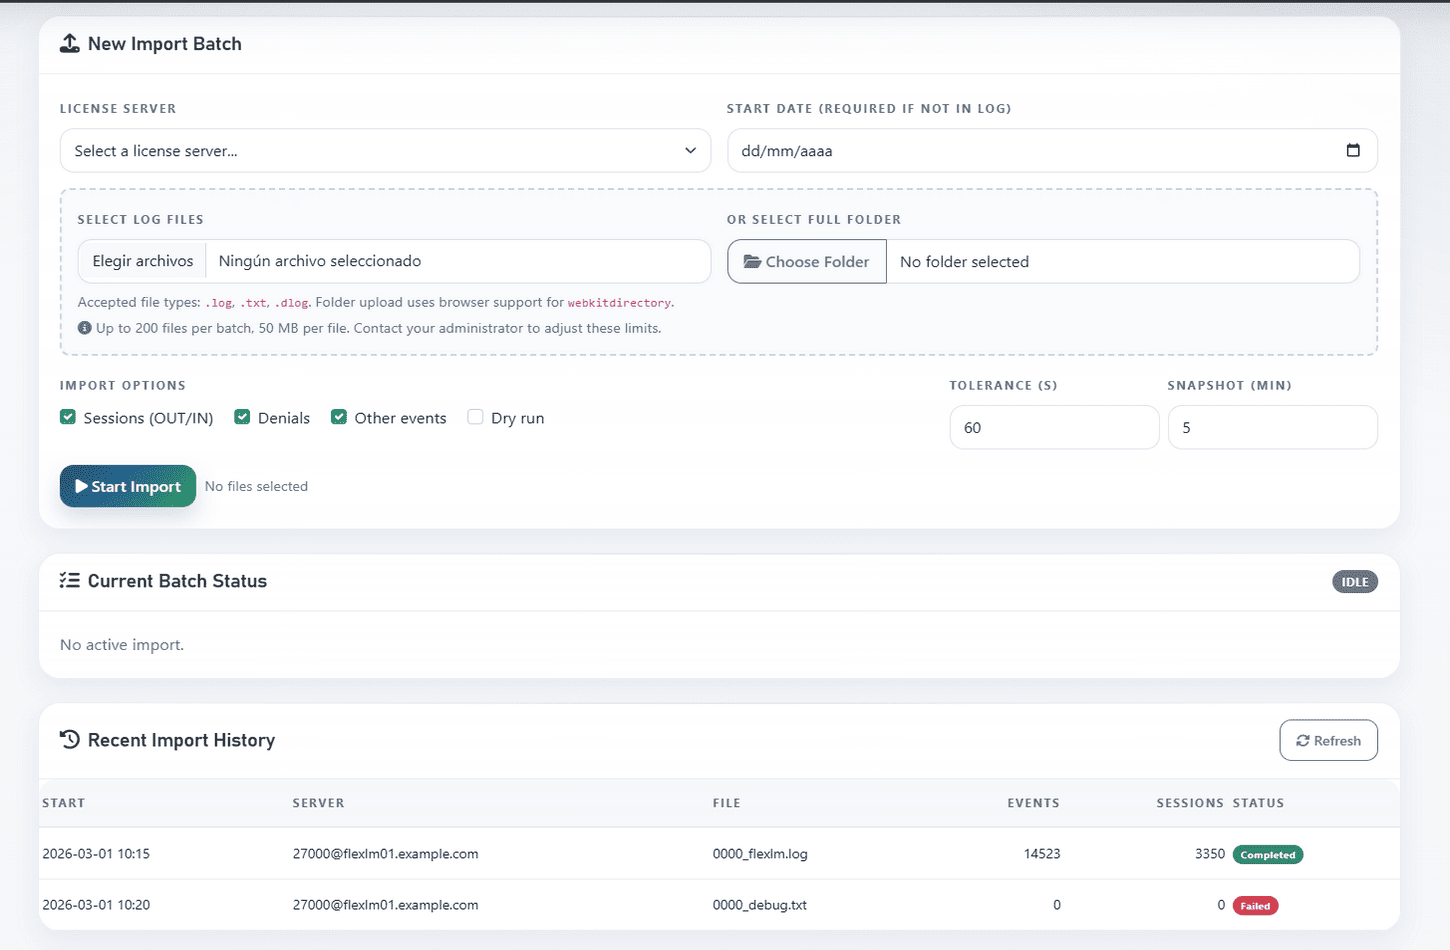
Example of log import:

Log import page for uploading DSLS, FlexLM, RLM, LM-X, or generic logs
Log Import brings debug log history into LiMon for denial, queue, timeout, and event analysis.

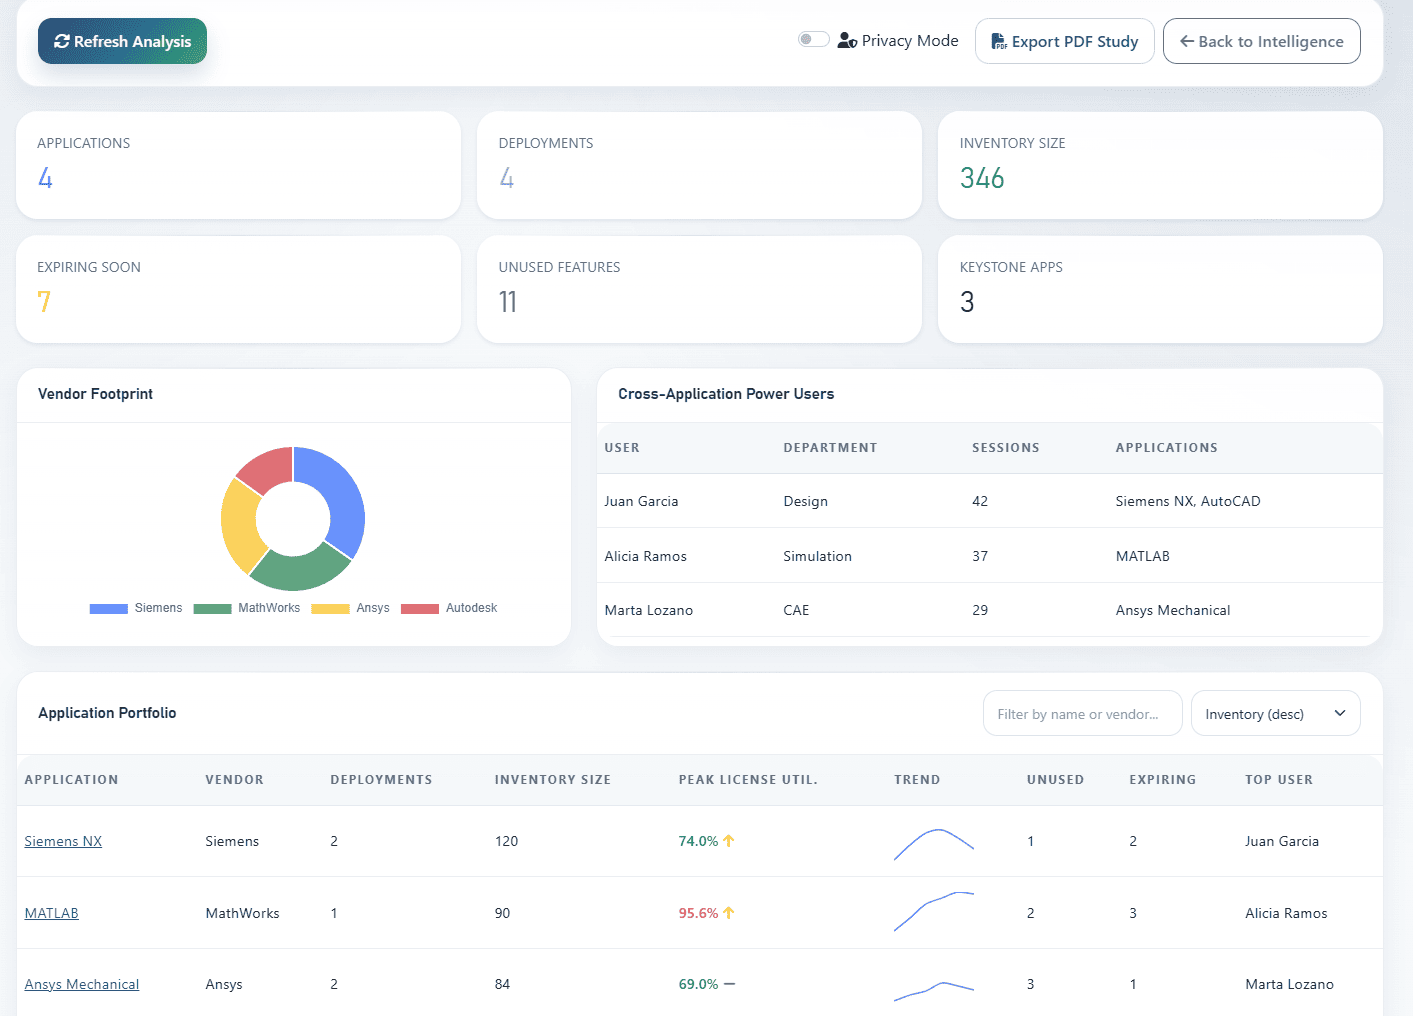
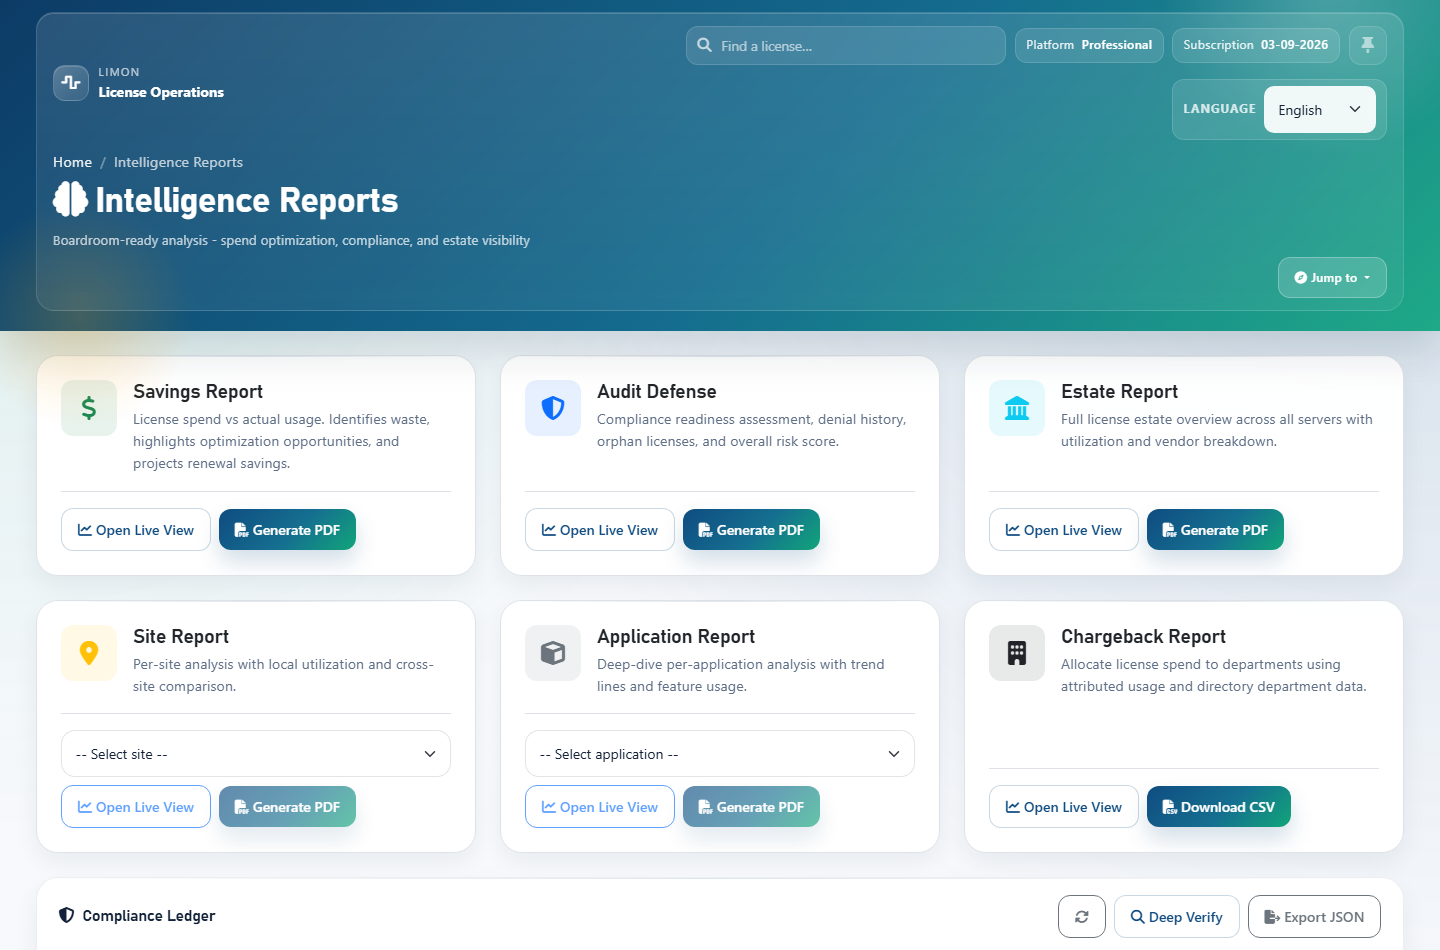
Example of the Intelligence hub:

Intelligence reports page with report cards for savings, audit, estate, application, site, and chargeback analysis
Intelligence views collect higher-level PDF and live report workflows when the relevant subscription features are enabled.

Example of the Estate web view:

Estate web view showing usage overview across LiMon applications
This partial sample of the Estate page shows how the web view summarizes usage across all applications defined in LiMon.