Live View
Live View is the monitor-generated operational dashboard. It is refreshed by the limon-monitor service on each polling cycle and is best suited for operators who need a fast status page: current server health, recent monitor activity, logs, parser warnings, and lightweight system metrics.
Use Live View when you want to know whether the monitoring service is healthy and what happened during recent polling. Use the Frontend when you want license analysis, application context, user views, reports, and business-facing navigation.
Where To Open It
Live View is linked from both the Admin UI and the Frontend jump menu. In Docker deployments, the generated monitoring output is served from the reports volume through the bundled proxy. In native package deployments, the same output normally lives under /opt/limon/reports/.
The monitor refreshes the generated files after each polling cycle, so Live View represents the most recent completed monitor run rather than an API-driven page that recomputes everything on demand.
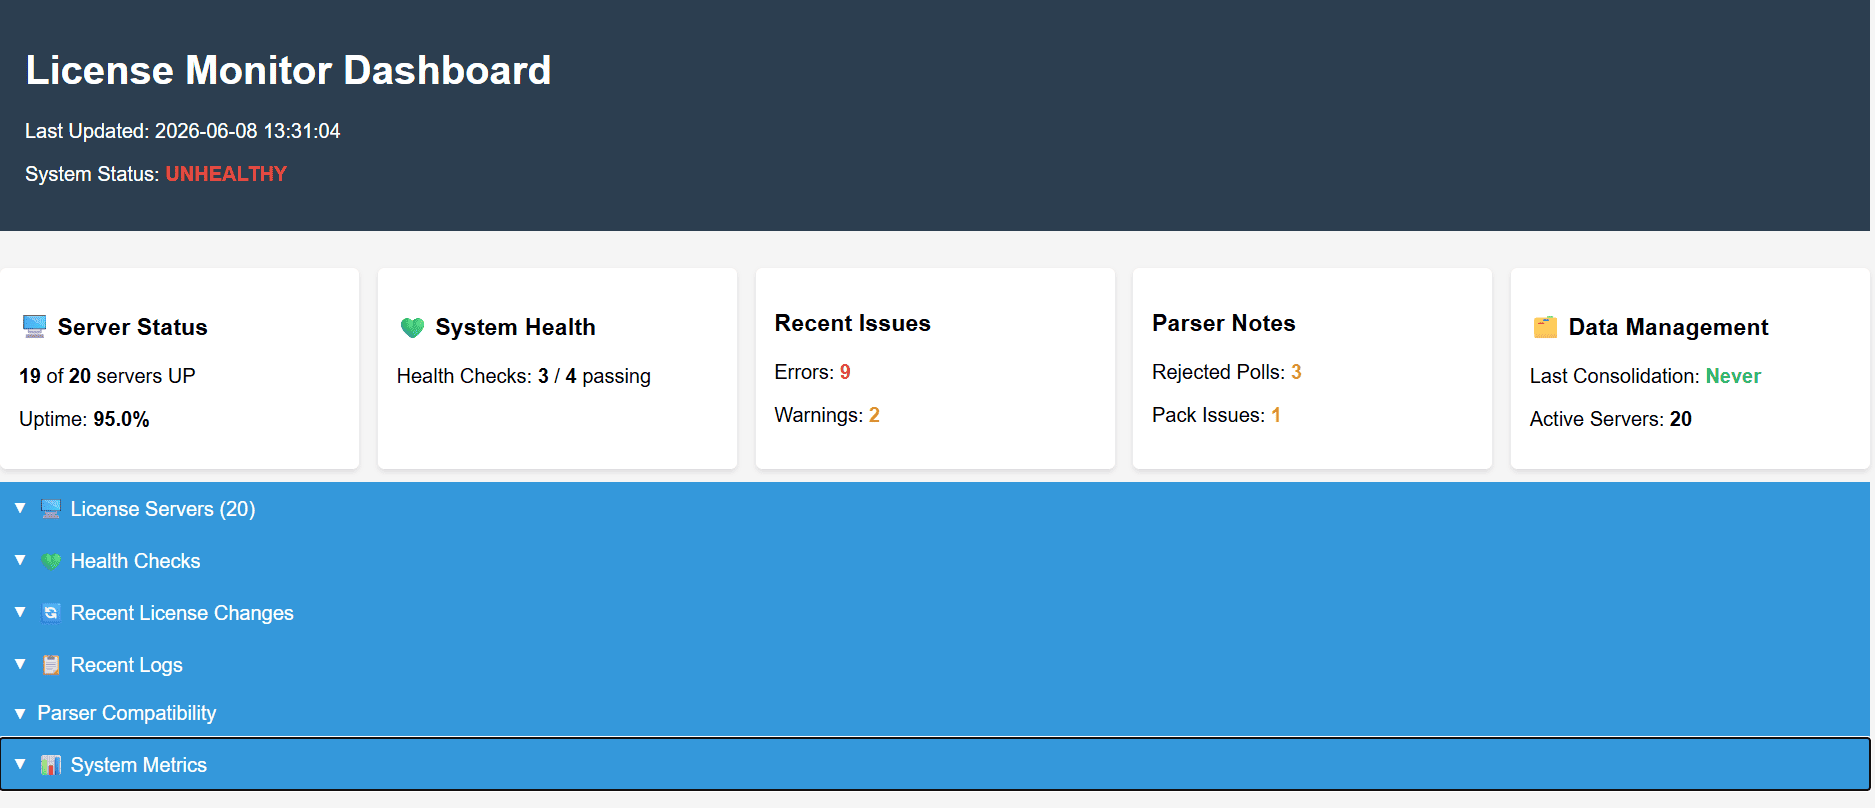
What It Shows
Live View is intentionally operator-focused. It helps answer questions such as:
- Is the monitor running and completing polling cycles?
- Which license servers are healthy, slow, unreachable, or returning warnings?
- Did the latest run produce errors that need attention?
- Are parser compatibility warnings or vendor-tool issues visible?
- How long are polling cycles taking, and is the configured interval realistic?
The generated output includes the Live View HTML plus data files such as current monitoring data, health status, server status, recent errors, parser compatibility diagnostics, and operational metrics.
Server Status
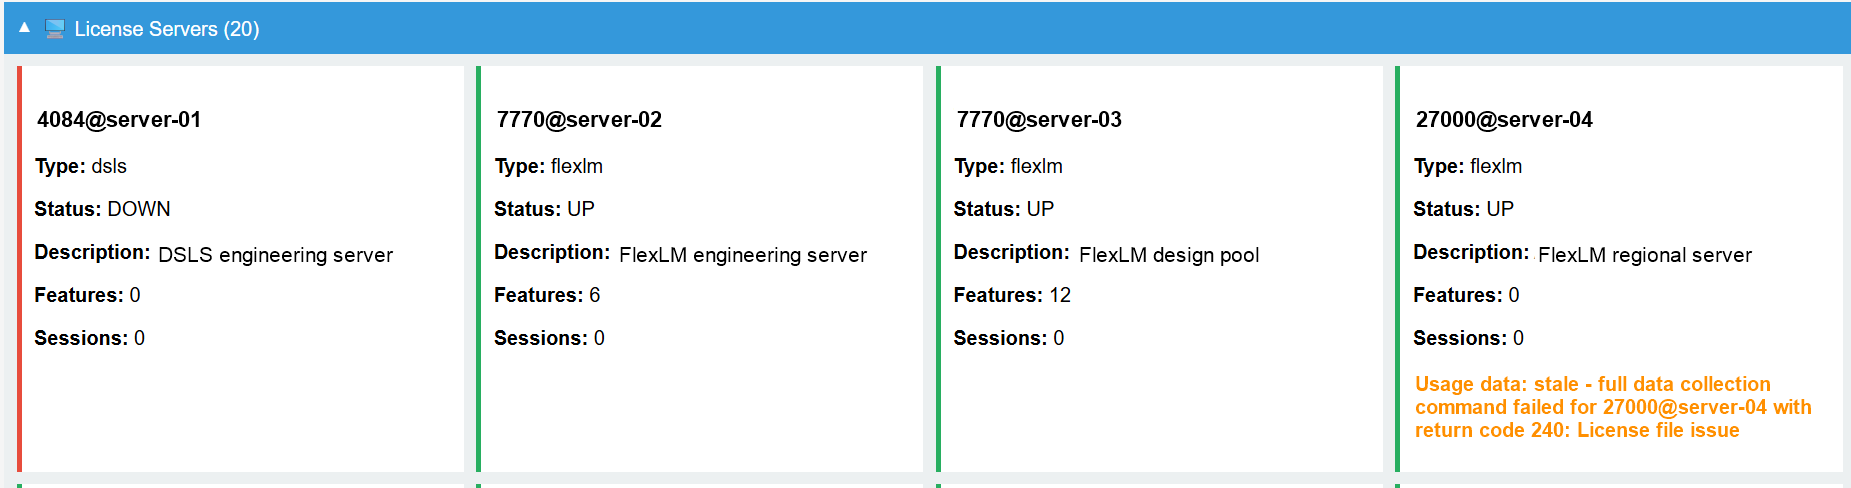
Use this section for quick operator triage: a down server, stale usage data, or a failed vendor command is visible without opening the Admin UI.
Recent Logs
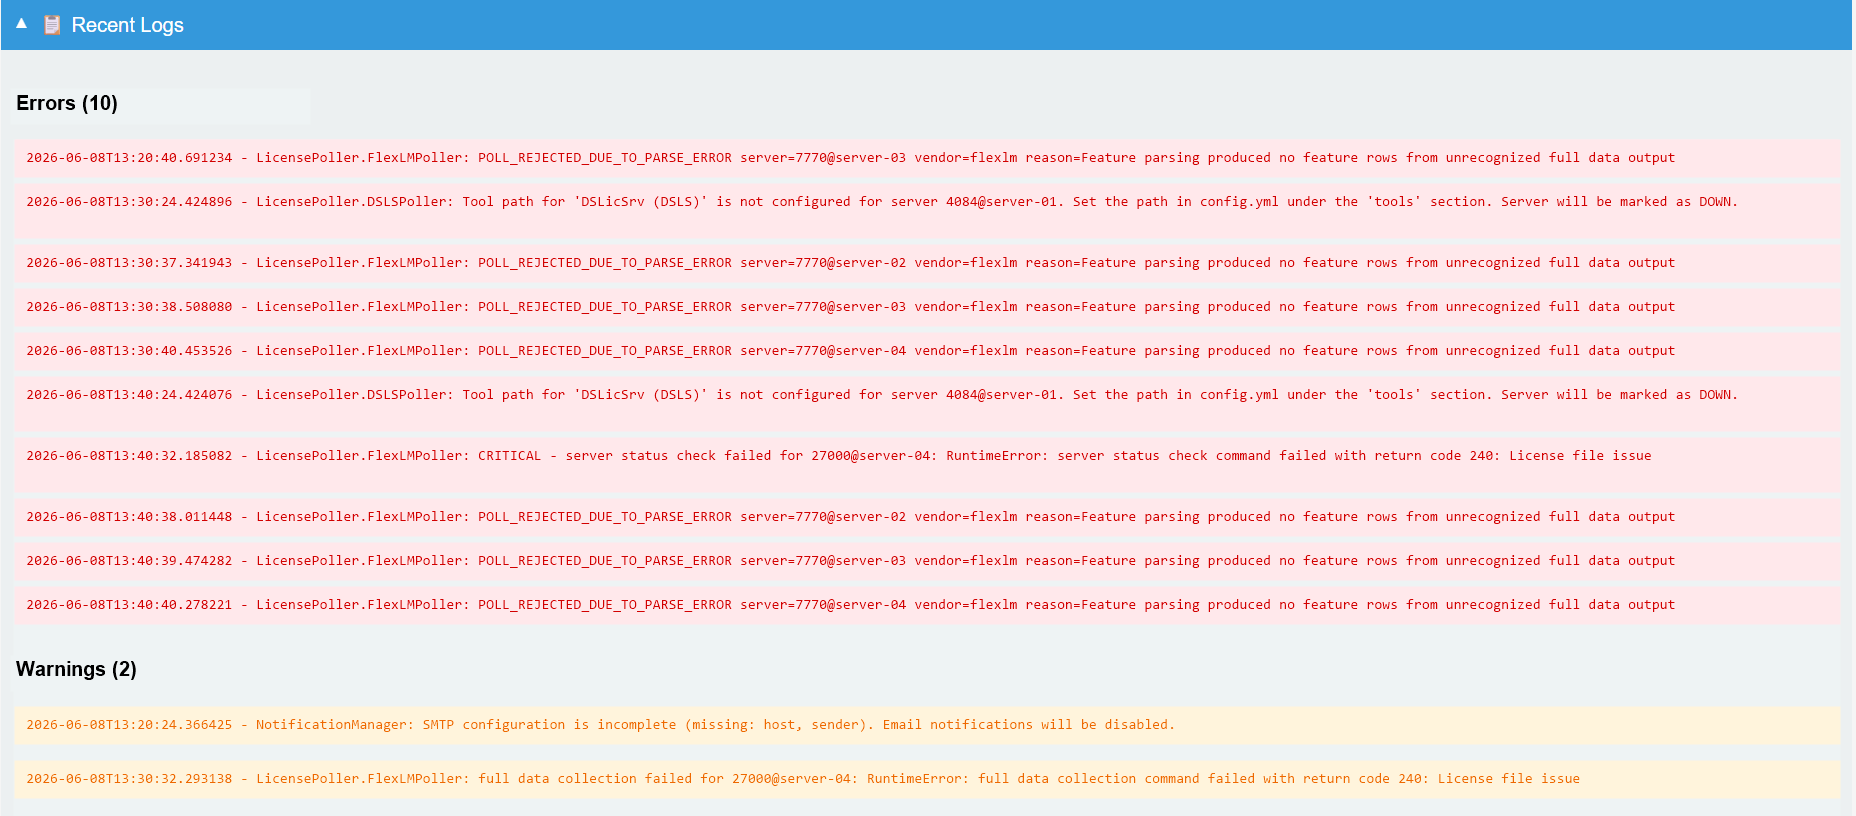
The log view is meant for the latest polling-cycle context rather than long-term audit history. Use it to spot repeated parser rejections, missing vendor binaries, or operational warnings before reviewing service logs.
System Metrics
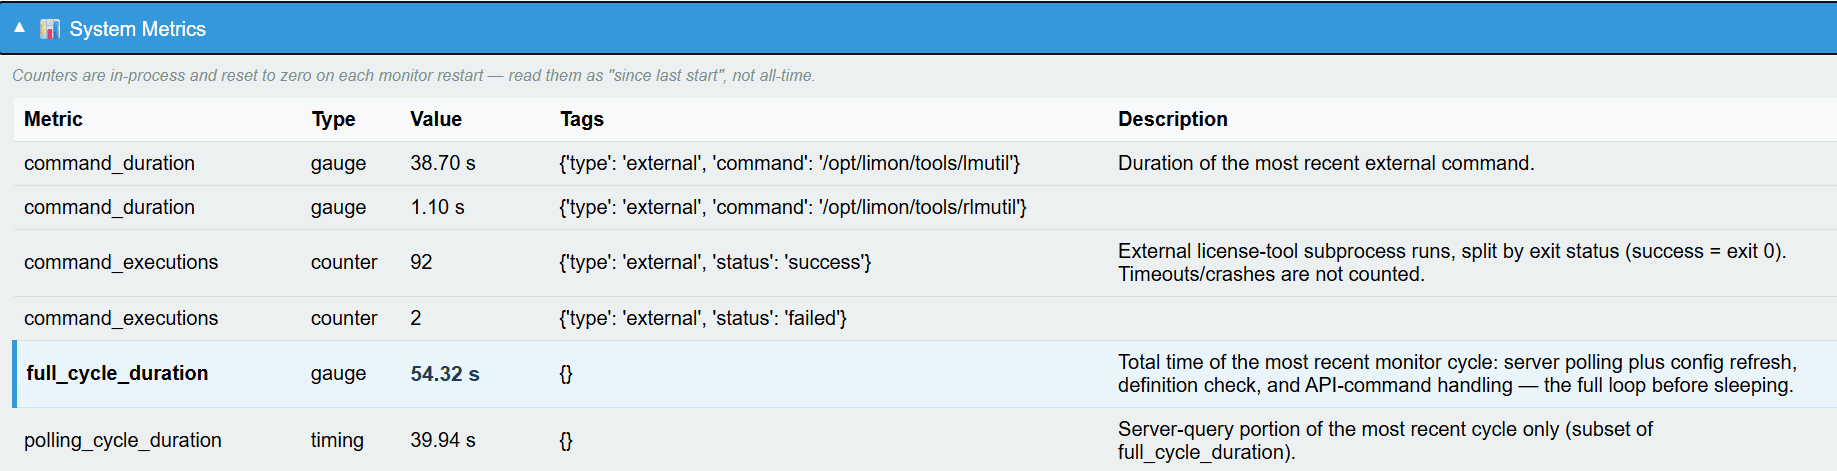
Metrics help decide whether polling duration is healthy for the configured interval. Counters are process-local and reset when the monitor restarts, so read them as current runtime evidence rather than all-time totals.
How It Differs From The Frontend
| Surface | Best for | Data style |
|---|---|---|
| Live View | Operator checks, monitor status, recent logs, lightweight metrics | Generated by limon-monitor after each polling cycle |
| Frontend | License usage, applications, users, denials, inventory, and report navigation | API-driven views backed by the database |
| Reports | Management, renewal, savings, audit, and finance evidence | Live report views, PDF artifacts, schedules, and exports |
If Live View looks stale, start by checking limon-monitor: the generated dashboard only updates when the monitor completes a cycle and writes the latest output.
Metrics And Integrations
Live View surfaces operational metrics for the monitor itself. These are different from business/utilization metrics such as peak usage, denial pressure, savings opportunities, or application compliance.
For Prometheus or similar tools, use:
That endpoint serves the latest monitor-generated Prometheus artifact with the correct content type. JSON-oriented integrations can use the generated metrics and health data artifacts when a static/offline handoff is more convenient.